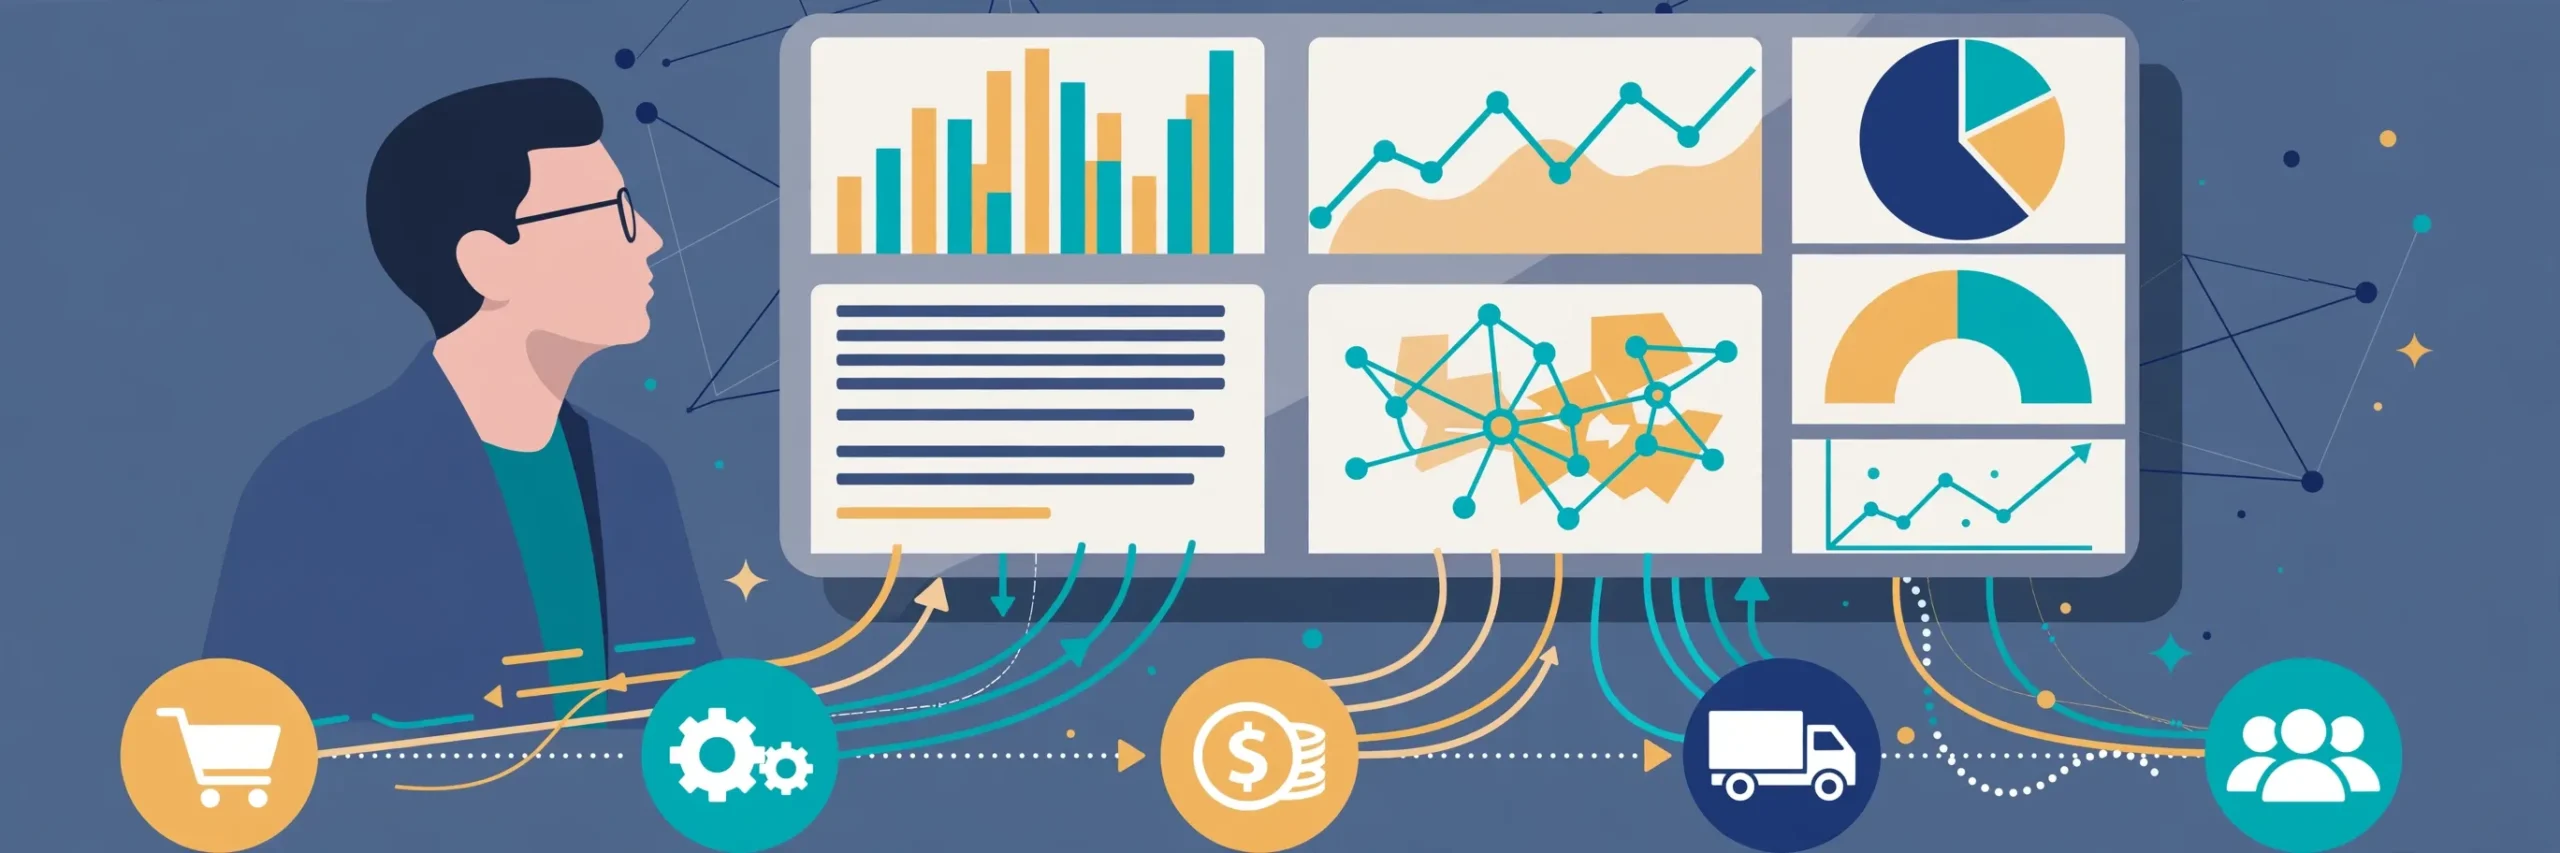
Why Management Information Systems Drive Better Decisions
First, a management information system turns raw data into usable reports. First, it collects data from daily operations. Then it processes that data into summaries. Finally, managers read those summaries and decide. In short, management information systems connect people, processes and technology. In particular, they serve decisions at every level of a firm. For example, a store manager checks daily sales on a dashboard. Meanwhile, a chief executive reviews quarterly trends on the same system. This paper-style answer covers MIS types, decision support, information quality and two worked examples.
Management information systems matter because decisions need timely facts. Consequently, a firm without MIS decides on guesswork. In contrast, a firm with MIS decides on evidence. This paper connects directly with our Operations Management paper. Specifically, daily operations generate the data MIS uses. Similarly, it links to our Strategic Management paper. There, long-term choices need the trends MIS reveals.
In simple terms, MIS sits between operations and strategy. First, transaction systems record each sale and purchase. Second, MIS turns those records into periodic reports. Third, senior systems add external data for strategy. In particular, examiners test this three-level ladder often. So name the level before you name the system. The decision support family extends MIS further. It adds models for semi-structured problems. It helps where no fixed rule exists.
MIS appears in every sector today. First, hospitals track patient flow and bed use. Second, banks monitor loan risk daily. Third, retailers track stock by store hourly. Fourth, universities track enrolment and grades. Finally, governments track tax collection monthly. In each case, the pattern repeats. Data enters at the bottom. Reports rise to managers. Decisions flow back down fast. Consequently, MIS is not a single product. It is a way of running a firm.
Types of Management Information Systems
In management information systems, type follows decision level. First, transaction processing systems handle routine work. They record sales, payments and stock movements. Second, MIS proper serves middle managers. It produces scheduled reports and summaries. Third, decision support systems aid complex choices. They run models and what-if analysis. Fourth, executive information systems serve top leaders. They show key indicators at a glance. Finally, enterprise systems join all functions. For example, ERP links finance, stock and human resources. Similarly, CRM tracks every customer contact. In addition, SCM links suppliers to stores. Consequently, type choice shapes the whole answer.
How Management Information Systems Support Decisions
First, structured decisions follow fixed rules. For example, reordering stock at a set level is structured. Second, semi-structured decisions mix rules and judgement. For example, setting a promotion budget is semi-structured. Third, unstructured decisions have no fixed rule. For example, entering a new country is unstructured. Overall, MIS serves structured decisions best. Similarly, DSS serves semi-structured decisions best. Likewise, EIS serves unstructured decisions best. In particular, examiners reward this mapping. So match the system to the decision type.
Information quality decides whether MIS helps or harms. First, accuracy means figures match reality. Second, timeliness means reports arrive before decisions. Third, completeness means no key fact is missing. Fourth, relevance means reports fit the question asked. For example, a daily sales report helps a store manager. However, it bores a chief executive. Consequently, good MIS filters by level. In short, it shows detail downwards and summaries upwards.
MIS Architecture: Inputs, Processing and Outputs
First, inputs feed every MIS. For example, they include sales records and stock counts. They also include external data like market prices. Second, processing cleans and summarises inputs. Specifically, it checks for errors first. Then it aggregates figures by period. Third, outputs reach managers as reports. In addition, they appear as dashboards and alerts. Finally, feedback closes the loop. Next, managers act on reports. Their actions create new data. Consequently, that data feeds the next cycle. In short, MIS is a loop, not a line. Indeed, a broken input breaks every later output.
Data warehouses support this loop further. First, they gather years of history in one store. Second, they clean duplicates and errors. Third, analysts query them freely. For example, a retailer may compare five years of festive sales. That view reveals slow-moving lines early. Consequently, warehouses turn MIS from reporting into insight. They cost more to build. But they repay larger firms fast.
Worked Example 1: MIS Cost-Benefit and Payback
Question (exam style): A retailer prepares sales reports by hand. Five staff spend 20 hours each per month on reports. Staff cost is $25 per hour. An MIS package costs $12,000 per year. With MIS, one staff member spends 10 hours per month on reports. Implementation costs $20,000 once. First, find annual manual cost. Second, find annual MIS cost. Third, find annual saving and payback period. Fourth, find the error reduction on 10,000 records.
Step 1 — Manual cost and MIS cost. First, manual hours are 5 × 20 = 100 hours per month. Manual cost is 100 × $25 = $2,500 per month. Consequently, annual manual cost is $2,500 × 12 = $30,000. MIS staff hours are 10 hours per month. Similarly, MIS staff cost is 10 × $25 = $250 per month. Annual MIS staff cost is $250 × 12 = $3,000. Finally, total annual MIS cost is $12,000 + $3,000 = $15,000.
| Item | Calculation | Result |
|---|---|---|
| Annual manual cost | 100 hrs × $25 × 12 | $30,000 |
| Annual MIS cost | $12,000 + $3,000 | $15,000 |
| Annual saving | $30,000 − $15,000 | $15,000 (50%) |
| Monthly saving | $15,000 ÷ 12 | $1,250 |
| Payback period | $20,000 ÷ $1,250 | 16 months |
| Manual errors | 8% × 10,000 | 800 |
| MIS errors | 1% × 10,000 | 100 |
Step 2 — Saving, payback and errors. Annual saving is $30,000 − $15,000 = $15,000. Indeed, that is a 50% cut in reporting cost. Monthly saving is $15,000 ÷ 12 = $1,250. Consequently, payback period is $20,000 ÷ $1,250 = 16 months. Manual errors are 8% × 10,000 = 800 records. In contrast, MIS errors are 1% × 10,000 = 100 records. Therefore, errors fall by 700 records per cycle.
What the Numbers Mean
Interpretation for the answer. In short, the MIS pays for itself in 16 months. After that, it saves $15,000 every year. However, payback alone understates the gain. Error reduction matters just as much. Fewer errors mean fewer wrong orders. Similarly, they mean fewer unhappy customers. Consequently, a top-mark answer counts both savings. It never reports payback without quality gains.
Intangible gains add further value. First, decisions arrive days earlier. Second, audit trails improve with system logs. Third, managers compare regions fairly. Fourth, staff focus on analysis, not copying. For example, a manager may spot a falling product line early. Consequently, she can act before losses grow. These gains resist exact pricing. Yet examiners still credit them. Name them after the numbers.
Worked Example 2: Dashboard Variance Analysis
Question (exam style): A firm sets quarterly sales targets. Q1 target is $300,000 and actual is $285,000. Q2 target is $320,000 and actual is $336,000. Q3 target is $350,000 and actual is $322,000. Q4 target is $400,000 and actual is $412,000. First, find each quarterly variance. Second, find annual target, actual and variance. Third, state the management action.
Step 1 — Quarterly variances. Q1 variance is $285,000 − $300,000 = −$15,000. In other words, that is −5% of target. Q2 variance is $336,000 − $320,000 = +$16,000. That is +5% of target. Q3 variance is $322,000 − $350,000 = −$28,000. That is −8% of target. Q4 variance is $412,000 − $400,000 = +$12,000. That is +3% of target.
| Quarter | Target | Actual | Variance | Variance % |
|---|---|---|---|---|
| Q1 | $300,000 | $285,000 | −$15,000 | −5% |
| Q2 | $320,000 | $336,000 | +$16,000 | +5% |
| Q3 | $350,000 | $322,000 | −$28,000 | −8% |
| Q4 | $400,000 | $412,000 | +$12,000 | +3% |
| Annual | $1,370,000 | $1,355,000 | −$15,000 | −1.1% |
Step 2 — Annual result and action. Annual target is $300,000 + $320,000 + $350,000 + $400,000 = $1,370,000. Actual sales total $285,000 + $336,000 + $322,000 + $412,000 = $1,355,000. Overall, variance is $1,355,000 − $1,370,000 = −$15,000. That is −1.1% of target. Therefore, the year looks nearly on target overall. However, Q3 hides the real story. Consequently, its −8% dip needs investigation at once.
What the Numbers Mean
Interpretation for the answer. In short, annual totals can mislead. Indeed, the year missed target by only 1.1%. Yet Q3 fell 8% short. A dashboard that shows quarters catches this early. In contrast, a dashboard that shows only annual totals hides it. Consequently, a strong answer recommends drill-down reports. For example, managers should click from annual to quarterly to regional figures. That path turns a report into a decision.
Benefits, Costs and Risks of Management Information Systems
First, MIS speeds decisions with timely reports. Second, it cuts routine labour costs fast. Third, it improves control through variance alerts. Fourth, it supports coordination across departments. However, costs are real too. Software licences cost money each year. In addition, training costs time and patience. Moreover, integration with old systems costs the most. In addition, risks deserve honest treatment. Staff may resist new systems strongly. Poor data in means poor reports out. Security breaches expose customer data fast. Information overload can paralyse managers too. Consequently, benefits need a risk paragraph beside them. Examiners reward balanced answers most.
Cloud MIS changes the cost picture further. First, firms rent software instead of buying it. Second, upgrades arrive without local teams. Third, small firms gain enterprise tools cheaply. However, cloud MIS raises new questions. Data sits on vendor servers abroad. Outages stop work everywhere at once. Vendor lock-in makes exit costly. In short, cloud shifts risk. It never removes risk.
Implementation success follows known factors. First, senior sponsorship must stay visible. Second, users need training before launch. Third, rollout should proceed in phases. Fourth, data must be cleaned first. For example, dirty customer records poison every report. Finally, success needs a feedback channel. Users report faults early. Developers fix them fast. Together, these factors beat technology alone. These topics link back to our Retail Management paper. There, point-of-sale data feeds MIS daily. They also link to our Business Environment paper. There, data rules shape what firms may store.
MIS Security and Ethics
First, MIS holds sensitive data in one place. Customer records and payroll figures sit together. Second, access control limits who sees what. Managers see their own teams only. Third, encryption protects data in transit. Fourth, backups protect against outages. However, ethics questions remain. Staff monitoring can feel intrusive fast. Customer profiling can cross privacy lines. Consequently, governance must set clear rules. It should state what data MIS may hold. It should also state who may view it. In short, security tools alone never suffice. Policy and culture complete the system.
How to Structure Your Management Information Systems Exam Answer
First, open with a definition in one line. Then name the decision level involved. Second, name the matching system type. Show TPS, MIS, DSS or EIS clearly. Third, test information quality next. Check accuracy, timeliness and relevance. Fourth, add a worked calculation where one exists. For example, show cost-benefit or variance in a table. Finally, close with a judgement from your numbers. Name the saving or the variance first. Then state the management action next. In short, answers that list system names without numbers lose marks. Similarly, answers that report totals without interpretation lose marks too. And when a question gives targets and actuals, always show variance percentages. That single step often earns the top band.
FAQs
What is the difference between MIS and DSS?
In short, MIS serves routine, structured decisions with scheduled reports. DSS serves semi-structured decisions with models instead. MIS answers what happened last month. DSS answers what might happen next. In practice, modern platforms blend both. The distinction still guides exam answers well.
What are the main types of management information systems?
First, transaction processing systems record daily work. Second, MIS produces reports for middle managers. Third, decision support systems model complex choices. Fourth, executive systems show key indicators. Finally, enterprise systems join all functions. For example, ERP joins finance and stock. CRM joins sales and service.
How does MIS improve decision-making?
First, MIS delivers timely and accurate reports. Second, it highlights variances from targets fast. Third, it lets managers drill down into detail. Fourth, it cuts time spent gathering data. Consequently, managers spend time deciding instead. They spend less time hunting for figures.
How should I answer a management information systems case study in an MBA exam?
First, identify the decision level and type. Second, name the matching system clearly. Third, test information quality in the case. Fourth, show any calculation with a table. Finally, interpret the numbers clearly. Name the saving or variance. Then state the management action next.